Investing in STR Today: Are there Deals?
 Kate Stoermer
A look at the data in 3 markets gives us insights into what saturation looks like and how to identify opportunities in todays STR market.
Defining Oversaturation in a Short-term Rental Market
As part of my business, I routinely look at short-term rental data in many markets. While many people talk about “too many rentals” and drops in their occupancy and revenue, the anecdotal stories are well supported by data in many, many markets. In fact, AirDNA’s latest “Best of Report” - which I posted about last week, also highlighted this issue.
I routinely get questions about how to identify opportunities given the oversaturation in many markets, so I thought I would share some of the data I’ve been looking at to aid others in assessing data to understand their market(s) and identifying what’s going on and if there is opportunity.
You may have seen some of this reported in my analysis of Coastal Western Michigan; today’s post is going to dig deeper into how to recognize oversaturation - and opportunity.
Let's start with definitions.
Average Daily Rate (ADR) | Average revenue generated, per night, for a rental. Typically reported by the data clearinghouses (i.e., AirDNA) as the amount of funds paid to the host/owner (minus the platform fees) divided by the number of booked nights. |
Occupancy Rate (Occ) | This is the number of booked nights divided by the number of available nights, as a percentage |
Average Revenue (Avg Rev) | Total revenue generated by number of active rentals |
Macro Market | The entire market - such as all the short-term rentals in a market, or all the 3-bedroom short-term rentals in a market |
Micro Market | A targeted, specific niche of a particular offering such as first tier oceanfront, or all 3 bedroom with a hot-tub, or all 1 bedrooms in a condo resort. |
Average as a Tool
One key concept here is the term “average”; in this space average can’t account for micro markets - the $1100/night rental and the $200/night rental are averaged together. What this means is that the data is helpful, but if you find a house that offers the crème de la crème in a market, oversaturation doesn’t matter. The top 20% in a market offer something many others can’t (location, as an example) or won’t (not updated to market standard or not being competitively price are frequent reasons) So, while this data is a starting point for assessing a market, it's not the end of the story by any means.
The data clearinghouses like AirDNA can’t account for micro markets specifically - while you can drill down into the specific number of bedrooms, you can’t drill down into all the 1-bedrooms in a condo complex. You have to narrow down manually to get to that level of data. Other data clearinghouses allow you to build comp sets (other STR that are directly comparable to yours) which is helpful but limited by the fact that many of those sources often rely strictly on Airbnb data and don’t include data from VRBO. In some markets that’s okay, in others - that’s a lot of data not accounted for.
So looking at averages at the market level helps to identify opportunities through trends, it's not helpful without additional analysis to narrow down to the micro-market.
What Does Oversaturation Look Like?
I’m going to give you trends in (3) markets, looking at occupancy, ADR, and the number of rentals in the market. Which one do you want to explore further? Why?

Market A’s occupancy and ADR continued an upward trend despite a significant increase in the number of rentals. I’d take a deeper look at that market as an investor. Market B has mixed signals - occupancy dropping, ADR climbed and then dropped, rentals dropped then really spiked. If it was a market of interest, I might peek to see what’s driving it and if there are opportunities as yet, but otherwise it's a pass for me. Market C - despite nearly doubling the available number of rentals, occupancy is stable but the key sign of saturation is the dropping ADR. That said, it's a fairly high ADR so - again, if it's a market of interest, maybe I’ll dig deeper to see if there are micro markets within this.
I don’t want you to get hung up on what markets these are, because let's face it - we all want the easy button. But if you read through to the end, I do tell you. Finding a solid investment when investing in real estate takes a fair amount of time and learning. (You can also just hop on a call with me and let's discuss your goals and see if I can help you achieve them!)
More often than not, these days, however, I start looking at a market differently - based on bedroom size as below. This looks at the number of rentals by bedroom size from 2021 to 2022, as well as the change in overall revenue by bedroom size.
Figure 1: Change in STR Supply and Revenue
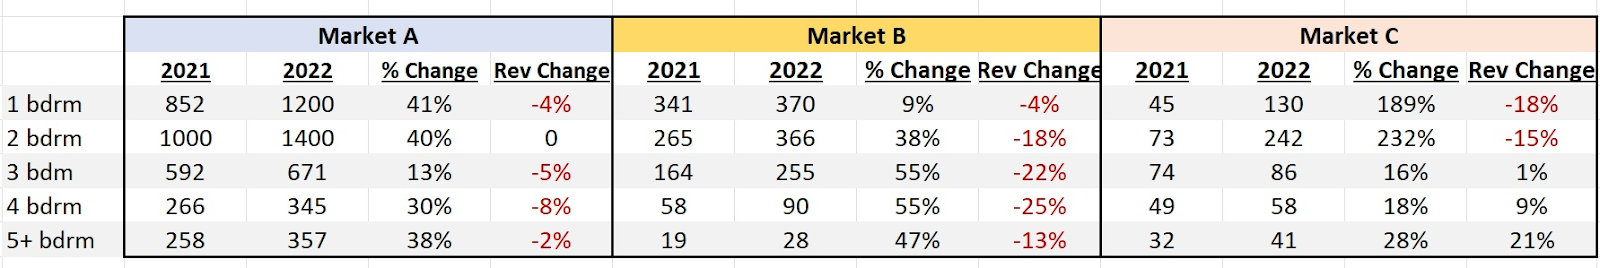
2021/2022 # active rentals in January of that year | % change in # active rentals | rev change is % of change in average revenue
You can see based on this view of the various markets how micro markets may work, and why there is value in assessing markets of interest from various angles. Market C illustrates opportunities may exist as the larger properties are not exhibiting signs of saturation - revenue went up in 2022 for the 3+ bedrooms. Although Market A looked okay in the macro view of the market, I’m not a fan looking at it from this view. Again, if I like the market for other reasons maybe I’d dig in to find the unicorns but I think this is a market on the cusp of saturation. Market B has clearly hit saturation on all fronts. Market C appears to have some opportunities, which was not evident when I ran just the overall market view.
I start assessing markets with this view these days, because in 2020/2021 markets overall tended to have plenty of opportunity, but nowadays opportunity lies in pockets and it requires more detailed analysis at the market level. I used to start with the house; now I look at what the need is and look to provide it.
Are there Deals In Market C?
As noted, Market C when viewed by bedroom size showed potential for the 3+ bedroom properties. So, just to illustrate the point, let's look deeper. My next stop for Market C is to assess the Top Grossing Properties for this market, which is something I love about using AirDNA. Looking at top grossing 3+ bedrooms - the top 9 grossing properties in this market gross between $188K/$583 ADR and $443K/$1399 ADR. All the top grossing properties are 4+ bedrooms, so I’m going to focus on 4+ bedrooms.

Based on Figure 2, I will be able to assess if the cost of housing in Market C for a 4+ bedroom makes sense. Based on the occupancy and ADR of 4+ bedrooms, STR in this market can average over $100,000/annual in gross revenue. Using $600 at 50%, it’s just over $109K. The top properties are grossing over $188K. So far, I’m liking these numbers.
I popped onto a couple of real estate sites and found a 4-bedroom property in this market at $649,000 - an existing rental that frankly looks tired and outdated. I did a quick run on the numbers and came up with a 6% cash on cash. That’s okay, its under my investment threshold but it MAY have a couple of attributes that could kick it up a notch in terms of desirability. In other words, it maybe able to be elevated into the higher tier as a top grossing property - and it cashflows as an "average property", so worth a deeper dive given the comps in the top grossing properties. I want to note that 6% includes debt servicing; the cap rate is 8.7%. Cap rate is the rate used in commercial and multi-family real estate investing; its the net operating income divided by the cost of the asset. If you aren't in real estate investing, that's fine but if you are - those folks speak cap rate.
Why These Markets?
I picked these (3) markets for fun. Two are well known short-term rental markets, the third market is one of interest to me personally. I actually didn’t know what I was going to find when I started this analysis for the purposes of writing this post - I would have told you Market A (Gatlinburg) was as saturated as Market B (Joshua Tree), based on anecdotal evidence and would never have thought Market C (I'll let you know which market it is when I buy the house!) would have cash flowed at all.
The moral of the story is to spend the time pulling the data. Don't crowd-source opinions when data can give you the information you need.
Summary
Oversaturation - the surplus of supply compared to demand, has been well described in a number of short-term rental markets. Anecdotally, it is described as “crickets” - low occupancy compared to prior years, not making the revenue projected, and a sense of “so many more rentals”. From a data standpoint, oversaturation is well described with significant jumps in numbers of rentals and a decrease in average revenue per unit.
But across the industry still lie opportunities for solid returns; finding those opportunities requires a more detailed understanding than it did a year or so ago. It requires really digging into micro-markets.
In 2021, demand was so high it was near impossible not to make money in many markets but as travel patterns are adjusting back to pre-pandemic habits - although demand is expected to remain fairly steady with a softening versus a drop, the influx of new rentals makes it more important to understand what makes a desirable rental in your chosen market - and avoiding markets that are truly saturated.
Now off to hit up my private money lenders to see if I can put in an offer in Market C. :-)
***
Hey Boss!
This analysis took me about an hour. But I do this multiple times a week, I’ve invested thousands of hours leaning into the industry, and I do this professionally. If you’d like to find your ideal STR investment, maybe you’d like to work together and leverage my time and expertise for your investment goals. If so, check out my Concierge Coaching Program or just hop on a call with me and lets chat!
