Unlocking Your Short-Term Rental’s Income Potential: A Strategic Guide
 Kate Stoermer
Learn how to analyze and boost your short-term rental income with data, strategy, and positioning in this in-depth guide for STR owners and investors.
In the world of short-term rentals, understanding income potential can challenge even those who are "spreadsheet people." For those who aren't? It can feel downright overwhelming. Add in imperfect data sources and wildly varying revenue among seemingly similar properties, and it's a recipe for confusion, frustration, doubt, analysis paralysis—or worse, a bad investment.
Understanding income potential is a key skill that can be learned—whether your goal is evaluating a property for investment or dialing in performance on one you already own. Sure, we can assess "average," but given all the variables and assumptions at play, it's understandable to feel less confident than you'd like.
Here’s the truth: income potential is always a range, not a single number. And that range is deeply impacted by how well a property is marketed and managed. Two nearly identical homes can produce wildly different income depending on guest experience, visual storytelling, pricing, reviews, and more.
In this guide, I’ll walk you through:
The basics of income analysis and where the numbers come from
Why the 50th percentile matters—and why you should be aiming for the 75th (if not beyond)
How market positioning and property management can stretch your income range upward
How to evaluate amenities for pricing vs. occupancy impact
The difference between inherent and engineered value
This is the framework I use in my income potential reports. Let’s dive in.
The Foundations of Income Potential
Income potential represents the possible annual revenue your property could generate based on market conditions, comps, and operating assumptions. It’s helpful to consider it in percentiles (25th, 50th, 75th) and understand that the final number depends heavily on what you do once you own or operate the property.
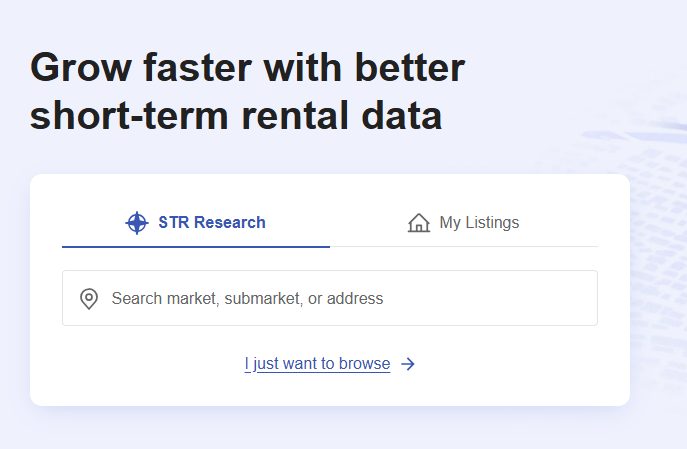
Primary data sources like AirDNA, Rabbu, and Mashvisor model income using assumptions about occupancy, pricing, and listing quality. That’s why context matters. Listings with few or no reviews, for example, tend to underperform and skew the average.
Before we dive into the nitty gritty, though, lets clear up a couple of definitions.
- Gross Revenue. This is ALL funds generated. This includes funds that never hit your bank account, like the platform fee retained by the booking site (i.e., the “Hosting Fee” charged by Airbnb or VRBO Commission). This also includes any cleaning, pet or other fees. Your gross revenue isn’t what hits your bank account, it is all funds generated. This is what is reported to the IRS.
- ADR. Average daily rate (ADR) is revenue divided by the number of nights rented in a time period - often annual.
- Data clearing house. Companies who specialize in sharing data about short-term rentals - i.e., AirDNA, Rabbu, etc. This data isn't typically based on all first-hand data; its scraped data which is then recreated into data sets and subject them to rigorous testing in order to provide quality data. This is because the platforms themselves (i.e., Airbnb) isn’t sharing their data and in order to have a complete picture of a market, you need data from all the platforms. Of course, no data clearing house is pulling data from everyone - they are making assumptions about direct bookings and some only use Airbnb data and don’t bother scraping VRBO. I typically tell people these companies can get you 80% of the way there, but you’ve got to verify through other means as well Learn more HERE >>
Why Percentiles Matter
Understanding percentiles allows us to gauge performance in a market. The 50th percentile is the baseline for most markets. I advise buying based on this benchmark—but aiming for the 75th through solid marketing, review strategy, and positioning. To be clear, buying at the 50th may mean it is a neutral ROI (ie, it covers its costs). If that isn't your goal, then move on. Everyone is different and has different goals. Some have cash flow goals, others have ROI goals, some like appreciation others aren't going to the bank for appreciation. Some don't care about the money provided it pays a property tax bill - they're here for the property itself. You pick YOUR goals and buy based on yours. If you need a goal? How would your funds be doing in the stock market? Because this is a lot more work than that.
So back to percentiles - Most data clearing houses can give you market-level data in percentiles. Should you pay to get that data? You are about to make a multiple hundred thousand dollar purchase. Yes, you should. Don't keep the subscription if you don't want to, but get the data. You can do ALOT for free, but quality data is worth the peace of mind in achieving your STR goals. I personally advise AirDNA - they've been around the longest and many other providers actually purchase their data from AirDNA.
Common Pitfalls to Avoid
Relying on ADR alone
Ignoring seasonality
Using properties with no guest history as comps
Choosing comps that aren’t truly comparable
Like anything commercial, short-term rental success is foundationally built on offering something consumers want and having a sufficient number of consumers hit your "book now" button. Some of my clients ask about saturation, and saturation is simply a way of saying supply is outstripping demand, which is impacting revenue. How can you tell saturation is impacting a market? The number of rentals has gone up and revenue has gone down is a strong indicator. But here's the truth; "over supply" means a plethora of available rentals that are serving the same audience. Properties that outperform even in a crowded market typically aren't perceived as "the same" and often do not suffer from revenue loss. Perception of a properties value is something that can be cultivated through good marketing. So, is saturation real? It can be. But is it inevitable? No. Even in a crowded market, a property can thrive.
The Invisible Hand — Market Positioning & Management
I can’t emphasize this enough - Two properties can be nearly identical on paper and still perform very differently. Why? Positioning and management.
Let’s say you have two 3-bed, 2-bath homes in the same neighborhood. One earns $85,000/year, the other $48,000. The higher-performing one likely:
Has better photos
Speaks clearly to a niche audience
Uses dynamic pricing
Has strong guest communication
Has a good reputation with reviews to match
Understanding Tiered Guest Expectations
When we think about "value," the truth is guests actually shop within tiers:
Budget
Economy
Midscale
Upscale
Luxury

Your listing has to match its tier. Amenities and pricing must align with the market place - or justify when it doesn't. When your property feels like the obvious choice for your ideal guest, conversion improves and income follows. Consider this - Luxury penthouse suite shows photos with grandma's old couch and reviews mention cleanliness issues and uncomfortable bed. The price? Top for the market. This is incongruent with "luxury" and out of sync with guest expectations. It erodes trust. But it can also work the other way. The old adage "too good to be true?". Some people will distrust that, too - a really great place with tons of great reviews at a bargain price is also incongruent. And honestly - the ones who book it may not be guests you want to host.
One of my pet peeves in the industry is a tendency to suggest a high ADR property is automatically a luxury property. MOST high ADR properties are high occupancy properties. Luxury is an experience, not a price point. Price is just signal of value. This is why percentiles + comparable properties are key to understanding income potential. The quickest way to unhappy guests? Advertise luxury and deliver less.
Strong Management Practices
Top-performing hosts avoid calendar gaps, automate (but personalize) communication, manage reviews, and handle maintenance efficiently. A guest's experience is consistent from listing to pre-arrival messaging to on-site experience to post-checkout follow-up.
Example: I took over a listing that was performing at average. By repositioning it toward families and promoting a unique floor plan more directly, I increased revenue by 23% in the first year—even while keeping pricing among the highest in the market. You can’t do this in long-term rentals, where rents are driven by asset class and location. STR is a marketers dream - you can significantly influence revenue through marketing and management just as I did here by highlighting a unique and desirable attribute.
What Actually Drives Revenue?
Not all features impact revenue the same way. Some boost ADR, some boost occupancy, and the best do both. And honestly - it will vary by market. Imagine my surprise when I found a market where having a pool had zero impact on the revenue?!! In most markets a pool always has some impact. But I share this to emphasize that ROI drivers truly are market specific, so drop your biases and run the numbers. That said, here are some common ones that in many (not all!) markets drive revenue.
Boost ADR | Drive Occupancy |
Hot tubs | Pet-friendliness |
Water access/views | Kid-friendly layout |
High-end finishes | Good Wi-Fi |
EV chargers | Convenient check-in |
Features like a fire pit may drive shoulder season bookings, but only if they’re visible in photos and clearly marketed.
How to Calculate ROI on an Amenity
Check if listings with the feature outperform those without
Look at mentions in reviews
Calculate how many extra nights or rate increase it would take to recoup costs
Remember: it’s not about listing everything—it’s about aligning features with what your ideal guest values.
Picking Competitors
Picking competitors is a skill of its own. In some markets, that may be straightforward - its a condo in a market with a plethora of condos. But in other markets - such as the "northern Michigan”; in the consumers eyes, they consider a large geographic range. The data clearinghouses are going to present data by geographic area (city or region), but the reality may be you are competing with properties far outside of that geographic area. For pricing purposes, as they narrow in, its okay to use near-by comps but its important to understand “market” from the consumers view and “market” from the data viewpoint may be very different.
Understanding and Communicating Value
There was a study that identified how consumers evaluate potential short-term rental properties to book, and determined we have a subconscious process that is fairly linear on (2) points. The first point along the journey is fit and trust (learn more about it HERE), and the second is Value. And perceptions of value absolutely drive revenue.
Consider these two headlines and price points -
Luxury 2 bdrm condo | King bed | Gourmet Kitchen (Priced at $447/night)
Comfortable condo | Nespresso | Updated (Priced at $299/night)
These could be the same condo, but what we say about it, how we present it, and how we price it communicates what we - as the operator, have decided its worth to our ideal guest.
And as someone who made the mistake in my first year hosting of under-valuing my property, I encourage you to question any biases you have based on “what you would pay for it” and look at the data and understand how your ideal guest is shopping and what they want and will find valuable.
689602fe26151_lg.jpg)
Beyond the Data — Turning Potential Into Performance
All Data is Backward-Looking
Every income projection—whether pulled from a dashboard, a market report, or a tool like AirDNA—is based on historical performance. That’s not a flaw; it’s just how data works.
What it doesn’t show is how the next version of that listing could perform:
With professional photos and a better hook
With stronger guest communication or automation
With a meaningful amenity added
With a strategy for reviews, messaging, or repeat stays
Your decisions determine whether you hit the average or break through it.
The Value of Interpretation and Intentionality
You don’t need to be an Excel wizard to understand income potential. But you do need to:
Understand the assumptions baked into the data
Clarify what makes your property different
Know who your ideal guest is
Account for market changes (e.g. new STR rules, added supply)
Expert Tip: When I perform income potential reports, I combine data with strategic analysis to:
Vet whether comps are truly comparable
Identify what’s helping or hurting performance
Translate "raw potential" into a clear roadmap
Because here’s the truth: Data doesn’t decide your outcome. Strategy does.
Five Tips for Evaluating STR Income Potential
If you're trying to assess what a property could earn—or why it isn’t earning what you expected—these five tips will help frame your analysis:
- Avoid relying on listings with low or no reviews
Tools like AirDNA are powerful, but comps with little guest history skew the data.
- Pull data based on occupancy first, then bedroom count
A 4-bedroom might sleep 8 or 14—that’s a big revenue difference. Think like your guest.
- Choose comps like a guest would
Use Airbnb or VRBO to see what real guests will see when booking. Your competition is who the platform recommends. (Keep in mind, the algorithms are increasingly personalized to the person searching, so everyone gets a personalized search result - but its still helpful to search as if you are your ideal guest!)
- Don’t use just one data source
Each platform uses different algorithms. Cross-check with AirDNA, Rabbu, PriceLabs, and even OTA reviews.
- Know what actually drives revenue in your market
Look at what amenities and positioning are converting—not just what looks good on a checklist.
689603b2a1b58_lg.jpg)
Inherent vs. Engineered Value in Short-Term Rentals
What About the 95th Percentile?
You might be wondering: “Why not aim for the 95th percentile?”
Truth is, many of the properties in my own portfolio operate there. But they have inherent value:
Walkability to major attractions
Unique architecture or views
Unusual or flexible layouts
A few years ago, I analyzed top-grossing listings in 55 markets. Most of them had some form of inherent value. Surprisingly, 75% were poorly marketed—but still performed.
Why? When something stands out and offers that “highly desirable” amenity in a market - guests overlook flaws like dark photos or minimal information.
I suspect if I redid that analysis today, it would be less true. Consumers in the short-term rental space have more options than they did, and to stay “at the top”, smart operators are doing a better job with their marketing efforts. But the point here is that properities with those Wow factors built in - wide range views, proximity to a highly desirable local attraction (ie ocean front), highly unique building etc don't typically have to work as hard to get booked (but its not a given, either!)
Engineering Value
Most properties aren’t born superstars. But they can still perform exceptionally.
That’s where engineering value comes in:
Intentional styling and staging
Thoughtful photography
Strategic messaging
Strong branding
Marketing doesn’t create ocean views, but it does create perception. And perception drives bookings.
So yes, 95th percentile is possible. But for most homes, strategic execution is how we get there.
Conclusion: Income Potential Isn’t Found—It’s Built
If there's one thing I want every STR owner, operator, or investor to remember, it’s this:
Income potential is a range. And the biggest determinant of where you land is you.
Data is helpful. But it’s not the full picture. Your decisions—how you market, manage, and message—transform averages into outcomes.
Whether you're:
Buying your first property
Optimizing a lagging performer
Pivoting your strategy
Don't just ask: "What could this property earn?"
Ask: "What would it take to earn more?"
Just Getting Started?
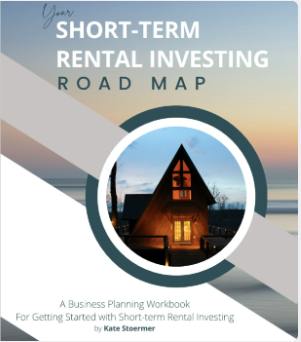
The advice I give folks is lean into learning. Podcasts, books, online content - get clarity about your goal and the path you believe suits you. Check out my Mentors From Afar for ideas of folks and resources I've leveraged in my own journey and grab my 30 page guide - and bonus analyzer spreadsheet to walk you through this process for only $5!!
🏡 Ready to start building your STR success story?
Watch the video, grab your roadmap, and take your first step toward owning a profitable short-term rental business — even if you're starting from scratch.
▶️ Watch the Video | 📚 Get the STR Roadmap | 📞 Book a Free Call
*****

Hey Boss! I'm Kate, owner/founder of The CEO Host. If you are interested in taking a leap into short-term rentals - or have some questions about your existing business, my goal - passion, and career, is to help YOU succeed. I've coached hundreds of folks getting started or looking to optimize, analyzed more deals (and duds) than I could count, completed thousands of hours of education and training, attended conferences... So don't be shy. A good CEO knows to bring in expert help - and that's what I'm here for! Lets HOP ON A CALL and chat!
Categories: : STR finances taxes and risk management